 midas media.

In 2025, a basement finishing and remodeling company spent $55,730.51 on Meta ads managed by Midas Media. The jobs that started as ad leads, 43 of them averaging $61,992, closed for $2,665,667.87 in revenue: 47.8 times the ad spend.
How much closed revenue actually comes from the ads?
Midas Media has managed this basement finishing and remodeling company's Meta ads since 2021, across four project types: basement finishing, whole-home remodels, ADU builds and custom homes. A single basement job is worth tens of thousands of dollars, so lead count was never the useful measure. The useful measure is how much closed revenue traces back to the ads, compared with the company's own website.
For 2025 that can be answered directly. Every closed job in the company's records notes which form the customer came through: one of the ad funnels, or the project form on the company's website.
$2.67M in closed jobs came from ad leads, on $55,730 of spend
| Lead source | Closed jobs | Revenue | Average job |
|---|---|---|---|
| Meta ad leads | 43 | $2,665,667.87 | $61,992 |
| Website form | 38 | $2,506,554.17 | $65,962 |
| All 2025 jobs | 81 | $5,172,222.04 | $63,855 |
Against $55,730.51 of Meta ad spend for the year, the jobs that started as ad leads brought in 47.8 times the spend. Ad leads made up 53% of the year's closed jobs and 52% of its revenue.
The 47.8x counts only jobs whose lead came in through an ad funnel. It leaves out every website job, even though many of those customers say they found the company on Instagram or Facebook (see below). That makes it the conservative figure.

The cost quiz closed jobs for $1,211 of ad spend each
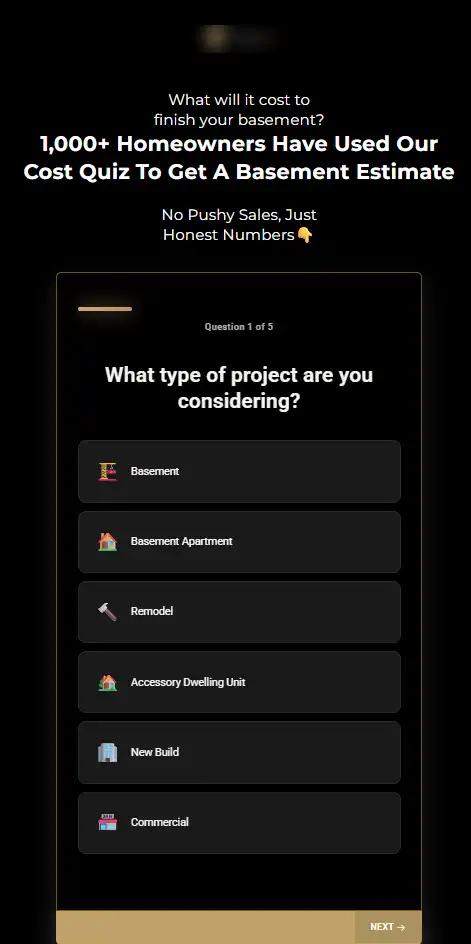
Most of the ad budget went to an interactive cost quiz: five questions about the project, then a cost estimate, then contact details.
| Metric | Value |
|---|---|
| Ad spend | $50,867.28 |
| Leads (Meta-reported) | 1,518 |
| Closed jobs | 42 |
| Ad spend per closed job | $1,211 |
| Closed revenue | $2,531,693.95 |
| Revenue per dollar of spend | 49.8x |
Judged on cost per lead, the quiz looks ordinary: $33.51 across all the quiz campaigns combined. Judged on cost per closed job, it carried the account: $1,211 of spend for a job worth about $60,000 on average.
Website leads close six times as often. Ads bring the volume.
| Lead source | Leads logged | Closed jobs | Close rate |
|---|---|---|---|
| Website form | 192 | 38 | 19.8% |
| Meta ad leads | 1,321 | 43 | 3.3% |
| All leads | 1,513 | 81 | 5.4% |
Leads from the company's website closed at 19.8%, about six times the 3.3% rate for ad leads. Ads still produced 87% of the leads the sales team worked and 53% of the closed jobs. The website is the efficient channel and the ads are the volume, and the business needs both.
Ad leads also took longer to decide: 64 days on average from lead to signed job, compared with 50 days for website leads.
Close rate here is jobs closed in 2025 divided by leads received in 2025, from the sales team's lead log. A few 2025 jobs began as late-2024 leads.
Many website leads found the company on Instagram or Facebook first
The website's project form asks how people heard about the company. In 2025, 155 of the 192 website leads answered, and they could choose more than one answer.
| How they heard | Share of people who answered |
|---|---|
| 38.1% | |
| 27.7% | |
| 18.7% | |
| Friend or neighbor | 12.3% |
| Other | 7.7% |
| Family member | 1.3% |
44% named Instagram or Facebook, more than named Google. The form can't separate a paid ad from an unpaid post, but those are the two places the ads run. Some of the website's 38 jobs likely trace back to the ads.
The same number of leads produced nearly twice as many jobs
| All sources | 2024 | 2025 |
|---|---|---|
| Leads logged | 1,472 | 1,513 |
| Closed jobs | 42 | 81 |
| Close rate | 2.9% | 5.4% |
| Closed revenue | $3,638,598.75 | $5,172,222.04 |
Leads rose 3% from 2024 to 2025. Closed jobs rose 93% and revenue rose 42%. This data can't prove what drove the change, but the usual levers apply: a funnel that asks more before it counts someone as a lead, like the five-question quiz above; targeting that reaches people ready to hire rather than browsers; and creative written for someone who wants to start soon. The number to watch is closed jobs per lead, not lead count.
Where these numbers come from
Every figure covers January 1 to December 31, 2025, except the 2024 column in the table above.
Ad spend and Meta-reported leads: Meta Ads Manager, every campaign in the account, January 1 to December 31, 2025.
Closed jobs and revenue: the company's list of closed jobs (81 in 2025). Each job records the form the customer submitted. Ad leads are the cost quiz funnel and the Facebook lead form. Website leads are the project form on the company's site. Every 2025 job has a recorded source.
Leads by source: the sales team's lead log (1,513 leads in 2025) and the website form's own records (192). Ad leads are the difference. Meta counted 1,579 lead form submissions in 2025, because it counts every submission it records while the team's log counts the leads it worked. Meta's count is used only for cost per lead.
How people heard: the website form's optional question, 155 answers in 2025, more than one choice allowed.
What this means if you run a remodeling or construction business
- Measure ads by closed revenue, not leads. Ad leads closed at 3.3% and still returned 47.8 times their cost, because each job averaged about $62,000.
- Judge a funnel by its cost per closed job. The quiz campaigns' combined $33.51 per lead looked ordinary. Its $1,211 per closed job is why it became the account's main funnel.
- Paid and organic work together. Website leads close six times as often, and 44% of the ones who answered say they found the company on Instagram or Facebook.
- Record the source of every closed job. This whole analysis rests on one column in the company's records: which form each customer came through.
- Pull ad spend from Ads Manager. Hand-kept spend logs tend to cover some campaigns and miss others. Ads Manager's export is the number to divide by.
Frequently asked questions
What's a good close rate for remodeling leads from Facebook ads?
In this company's 2025 data, ad leads closed at 3.3% (43 jobs from 1,321 logged ad leads) and website leads closed at 19.8% (38 jobs from 192). A low close rate can still be very profitable: the ad jobs averaged $61,992 and returned 47.8 times their ad spend.
Do website leads convert better than Facebook ad leads for contractors?
Yes, about six times better here. But ads supplied 87% of the leads the sales team worked and 53% of the closed jobs, and 44% of website leads who answered said they found the company on Instagram or Facebook.
Does a cost quiz funnel work for home remodeling ads?
In this account the cost quiz turned $50,867.28 of 2025 ad spend into 42 closed jobs worth $2,531,693.95. That is $1,211 of ad spend per closed job and 49.8 times the spend in revenue.
How much does a remodeling lead cost on Meta ads?
In 2025 this account averaged $35.29 per Meta-reported lead across all campaigns. The cost quiz campaigns averaged $33.51 per lead combined: the basement quiz, which drew most of the leads, ran $37.82, and the custom home quiz ran $9.12. For high-ticket work, cost per closed job is the better measure.
What's a realistic ROAS for a remodeling company on Meta ads?
Here it was 47.8x in 2025: $2,665,667.87 in closed jobs from ad leads against $55,730.51 of ad spend. It counts only jobs whose lead came through an ad, so it understates the ads' full effect. High-ticket categories produce large multiples because a few closed jobs cover a year of spend.
How long do ad leads take to close for a basement finishing company?
In 2025, jobs from ad leads took 64 days on average from lead to signed contract. Jobs from website leads took 50 days.
What is your ad spend returning in closed jobs? We trace your leads to signed contracts, the way we did here, and show you which campaigns pay for themselves. See how our Meta ads work, or book a strategy call.